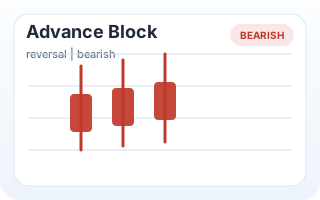
Advance Block
Bearish pattern used to watch for weakening demand, downside reversal, or continuation.
 Apollo Economic Research
Technical reference
A practical chart library pulled from the Apollo WordPress database. Use the filters to scan bullish, bearish, continuation, and neutral formations.
Bearish pattern used to watch for weakening demand, downside reversal, or continuation.
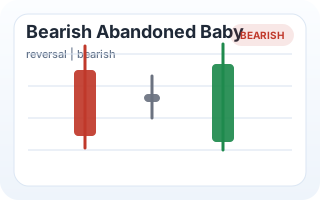
Bearish pattern used to watch for weakening demand, downside reversal, or continuation.
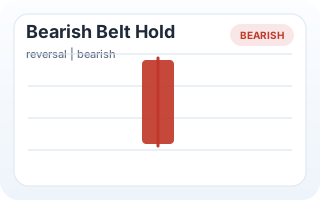
Bearish pattern used to watch for weakening demand, downside reversal, or continuation.
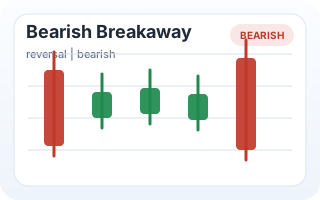
Bearish pattern used to watch for weakening demand, downside reversal, or continuation.
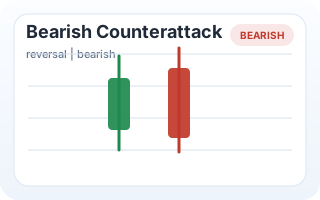
Bearish pattern used to watch for weakening demand, downside reversal, or continuation.
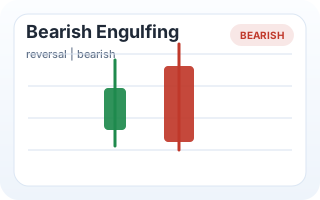
Bearish pattern used to watch for weakening demand, downside reversal, or continuation.
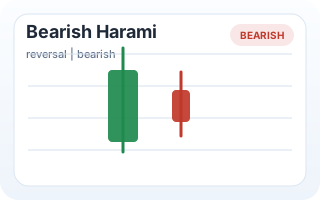
Bearish pattern used to watch for weakening demand, downside reversal, or continuation.
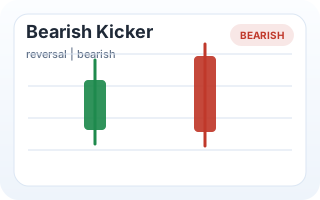
Bearish pattern used to watch for weakening demand, downside reversal, or continuation.
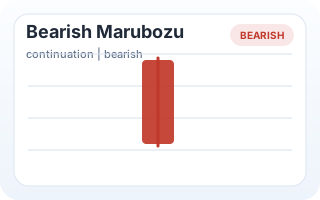
Bearish pattern used to watch for weakening demand, downside reversal, or continuation.
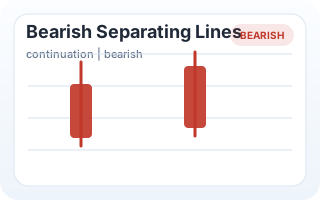
Bearish pattern used to watch for weakening demand, downside reversal, or continuation.
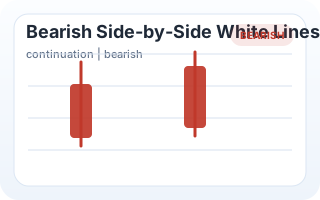
Bearish pattern used to watch for weakening demand, downside reversal, or continuation.
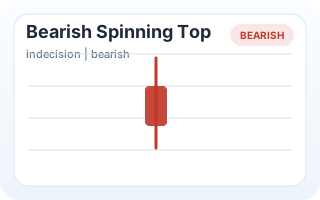
Bearish pattern used to watch for weakening demand, downside reversal, or continuation.
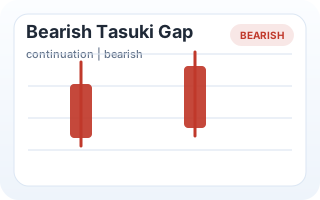
Bearish pattern used to watch for weakening demand, downside reversal, or continuation.
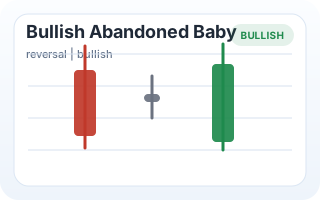
Bullish pattern used to watch for improving demand, upside reversal, or continuation.
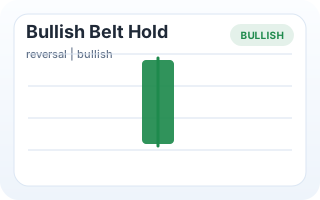
Bullish pattern used to watch for improving demand, upside reversal, or continuation.
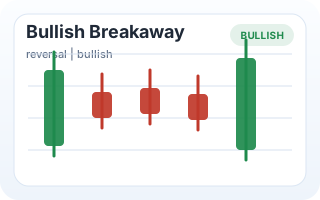
Bullish pattern used to watch for improving demand, upside reversal, or continuation.
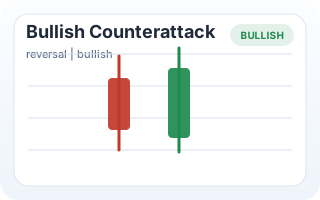
Bullish pattern used to watch for improving demand, upside reversal, or continuation.
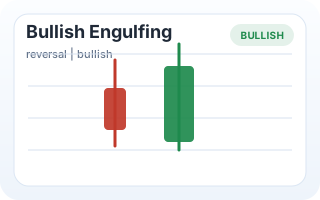
Bullish pattern used to watch for improving demand, upside reversal, or continuation.
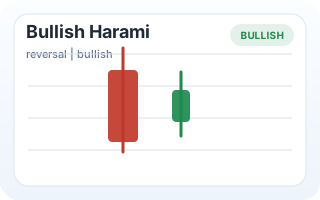
Bullish pattern used to watch for improving demand, upside reversal, or continuation.
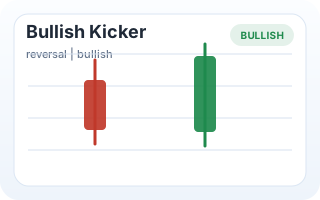
Bullish pattern used to watch for improving demand, upside reversal, or continuation.
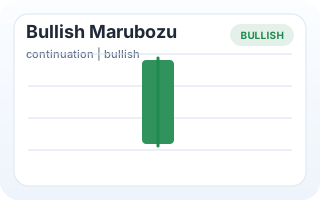
Bullish pattern used to watch for improving demand, upside reversal, or continuation.
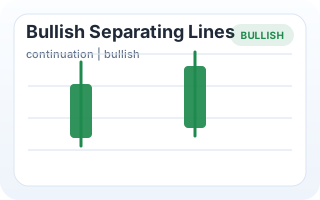
Bullish pattern used to watch for improving demand, upside reversal, or continuation.
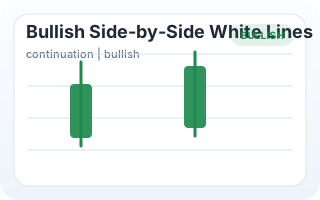
Bullish pattern used to watch for improving demand, upside reversal, or continuation.
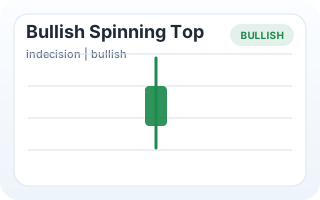
Bullish pattern used to watch for improving demand, upside reversal, or continuation.
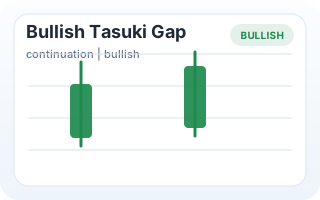
Bullish pattern used to watch for improving demand, upside reversal, or continuation.
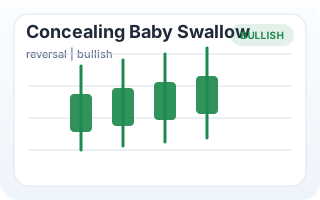
Bullish pattern used to watch for improving demand, upside reversal, or continuation.
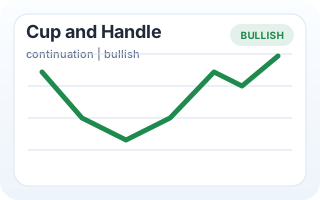
Bullish pattern used to watch for improving demand, upside reversal, or continuation.
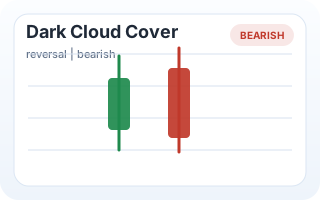
Bearish pattern used to watch for weakening demand, downside reversal, or continuation.
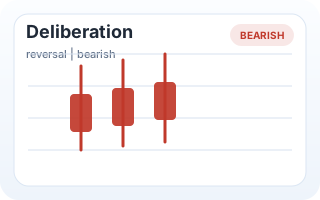
Bearish pattern used to watch for weakening demand, downside reversal, or continuation.
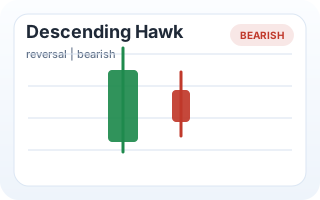
Bearish pattern used to watch for weakening demand, downside reversal, or continuation.
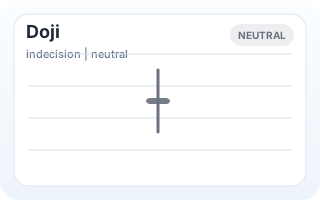
Neutral or indecision pattern used to study balance, volatility, and trend hesitation.
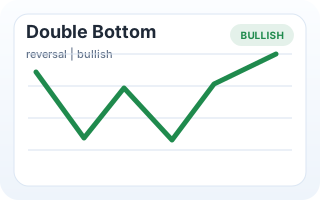
Bullish pattern used to watch for improving demand, upside reversal, or continuation.
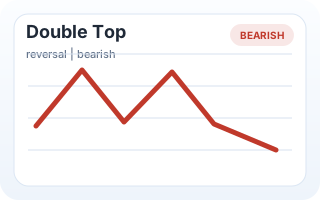
Bearish pattern used to watch for weakening demand, downside reversal, or continuation.
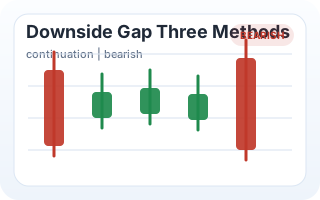
Continuation or gap pattern used to study whether the current trend is holding.
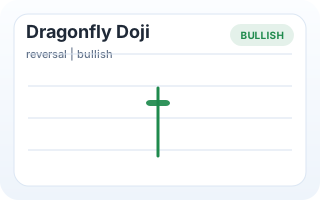
Neutral or indecision pattern used to study balance, volatility, and trend hesitation.
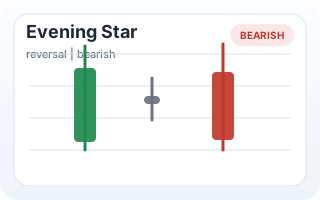
Bearish pattern used to watch for weakening demand, downside reversal, or continuation.
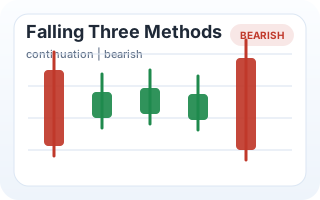
Continuation or gap pattern used to study whether the current trend is holding.
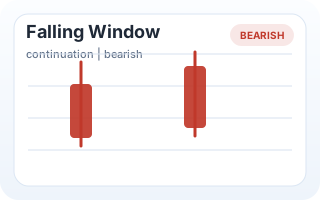
Bearish pattern used to watch for weakening demand, downside reversal, or continuation.
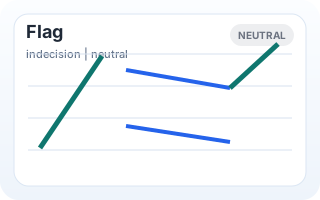
Continuation or gap pattern used to study whether the current trend is holding.
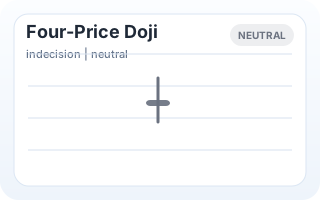
Neutral or indecision pattern used to study balance, volatility, and trend hesitation.
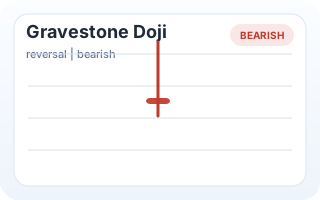
Neutral or indecision pattern used to study balance, volatility, and trend hesitation.
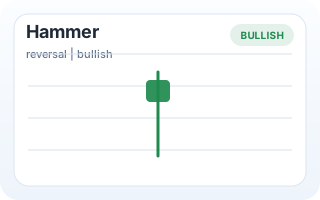
Bullish pattern used to watch for improving demand, upside reversal, or continuation.
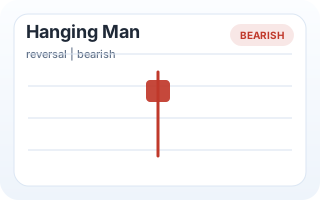
Bearish pattern used to watch for weakening demand, downside reversal, or continuation.
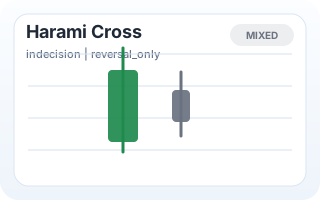
Neutral or indecision pattern used to study balance, volatility, and trend hesitation.
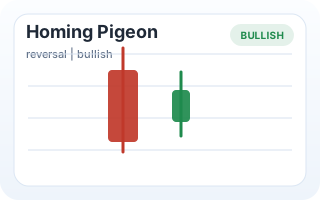
Bullish pattern used to watch for improving demand, upside reversal, or continuation.
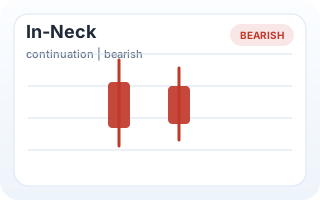
Neutral or indecision pattern used to study balance, volatility, and trend hesitation.
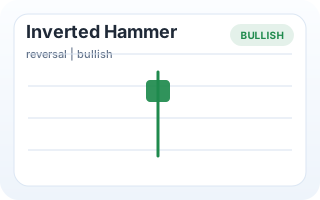
Neutral or indecision pattern used to study balance, volatility, and trend hesitation.
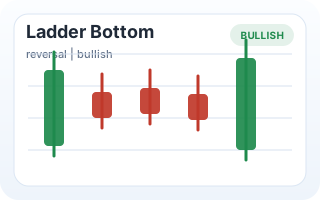
Bullish pattern used to watch for improving demand, upside reversal, or continuation.
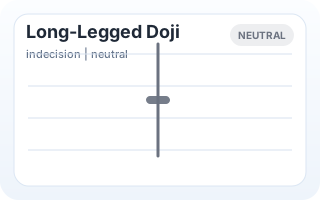
Neutral or indecision pattern used to study balance, volatility, and trend hesitation.
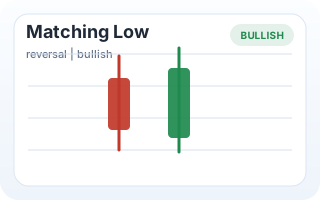
Bullish pattern used to watch for improving demand, upside reversal, or continuation.
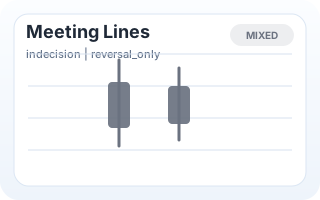
Neutral or indecision pattern used to study balance, volatility, and trend hesitation.
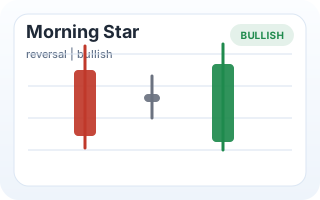
Bullish pattern used to watch for improving demand, upside reversal, or continuation.
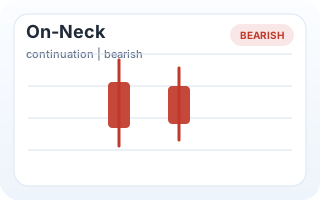
Neutral or indecision pattern used to study balance, volatility, and trend hesitation.
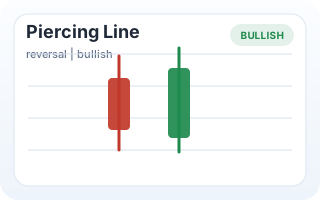
Bullish pattern used to watch for improving demand, upside reversal, or continuation.
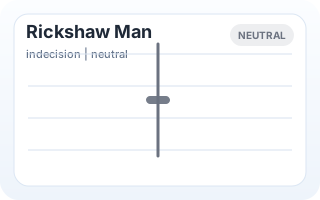
Neutral or indecision pattern used to study balance, volatility, and trend hesitation.
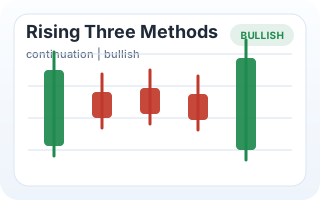
Continuation or gap pattern used to study whether the current trend is holding.
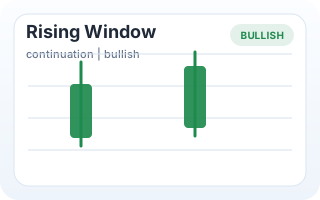
Bullish pattern used to watch for improving demand, upside reversal, or continuation.
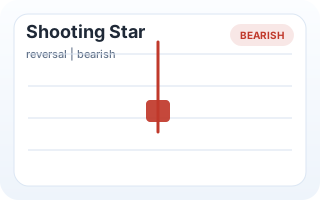
Bearish pattern used to watch for weakening demand, downside reversal, or continuation.
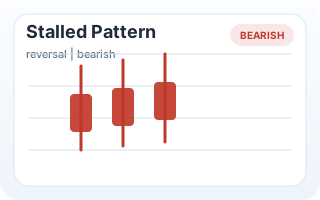
Bearish pattern used to watch for weakening demand, downside reversal, or continuation.
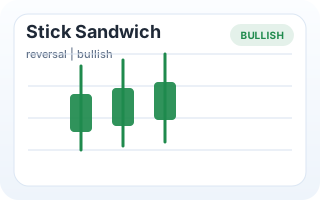
Neutral or indecision pattern used to study balance, volatility, and trend hesitation.
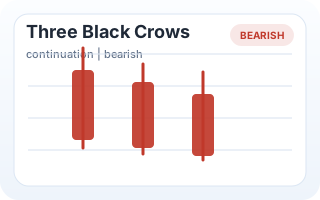
Bearish pattern used to watch for weakening demand, downside reversal, or continuation.
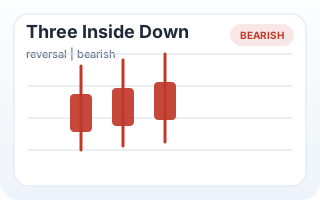
Neutral or indecision pattern used to study balance, volatility, and trend hesitation.
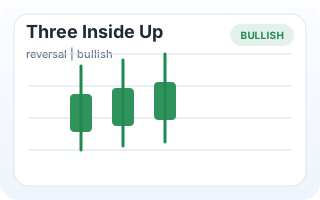
Neutral or indecision pattern used to study balance, volatility, and trend hesitation.
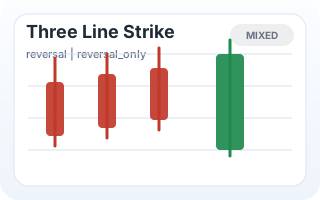
Neutral or indecision pattern used to study balance, volatility, and trend hesitation.
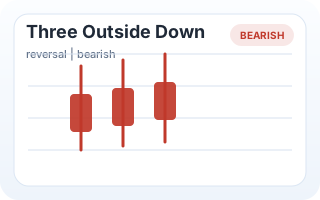
Neutral or indecision pattern used to study balance, volatility, and trend hesitation.
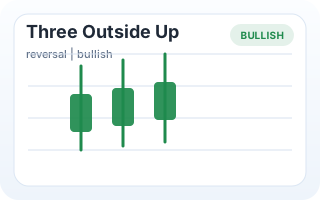
Neutral or indecision pattern used to study balance, volatility, and trend hesitation.
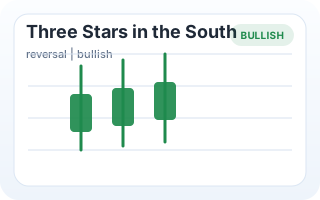
Neutral or indecision pattern used to study balance, volatility, and trend hesitation.
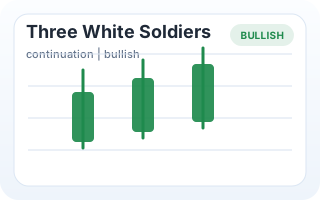
Neutral or indecision pattern used to study balance, volatility, and trend hesitation.
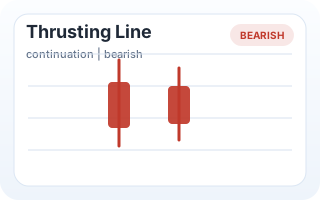
Neutral or indecision pattern used to study balance, volatility, and trend hesitation.
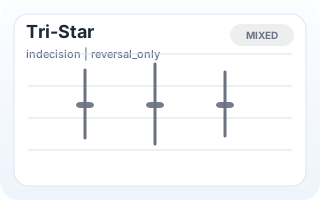
Neutral or indecision pattern used to study balance, volatility, and trend hesitation.
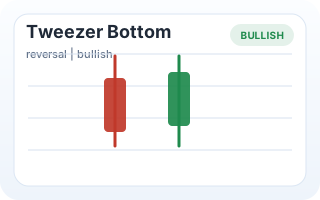
Bullish pattern used to watch for improving demand, upside reversal, or continuation.
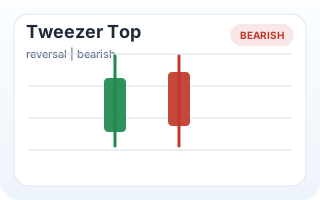
Bearish pattern used to watch for weakening demand, downside reversal, or continuation.
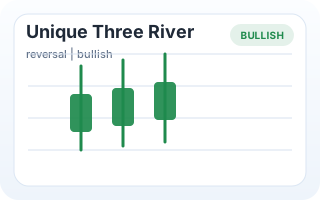
Bullish pattern used to watch for improving demand, upside reversal, or continuation.
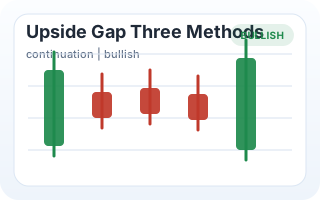
Continuation or gap pattern used to study whether the current trend is holding.
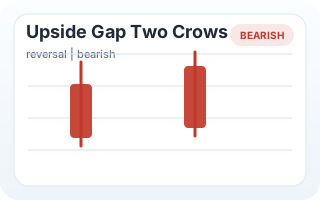
Bearish pattern used to watch for weakening demand, downside reversal, or continuation.
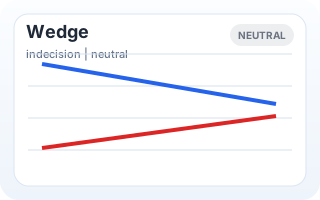
Continuation or gap pattern used to study whether the current trend is holding.